Results Contours#
|
In this example we will demonstrate how to:
|
from dlubal.api import rfem
from dlubal.api.common import vtk_visualizer
# Connect to the RFEM application
with rfem.Application() as rfem_app:
# Get results for specific `result_type` in form of isobands/isolines as DataFrame with VTK polydata
isoline_lc1_df = rfem_app.get_result_contour(
results_type=rfem.results.STATIC_ANALYSIS_SURFACES_EQUIVALENT_STRESSES_MISES_MESH_NODES,
contour_type=rfem.results.settings.CONTOUR_TYPE_ISOBAND,
filters=[
rfem.results.ResultsFilter(column_id="loading", filter_expression="LC1"), # Loading case LC1
rfem.results.ResultsFilter(column_id="surface_no", filter_expression="6,7,8,9"), # Surfaces 6 to 9
]
).data
# Extract VTK polydata just for specific result magnitude to visualize it
polydata = vtk_visualizer.get_vtk_polydata(
df=isoline_lc1_df,
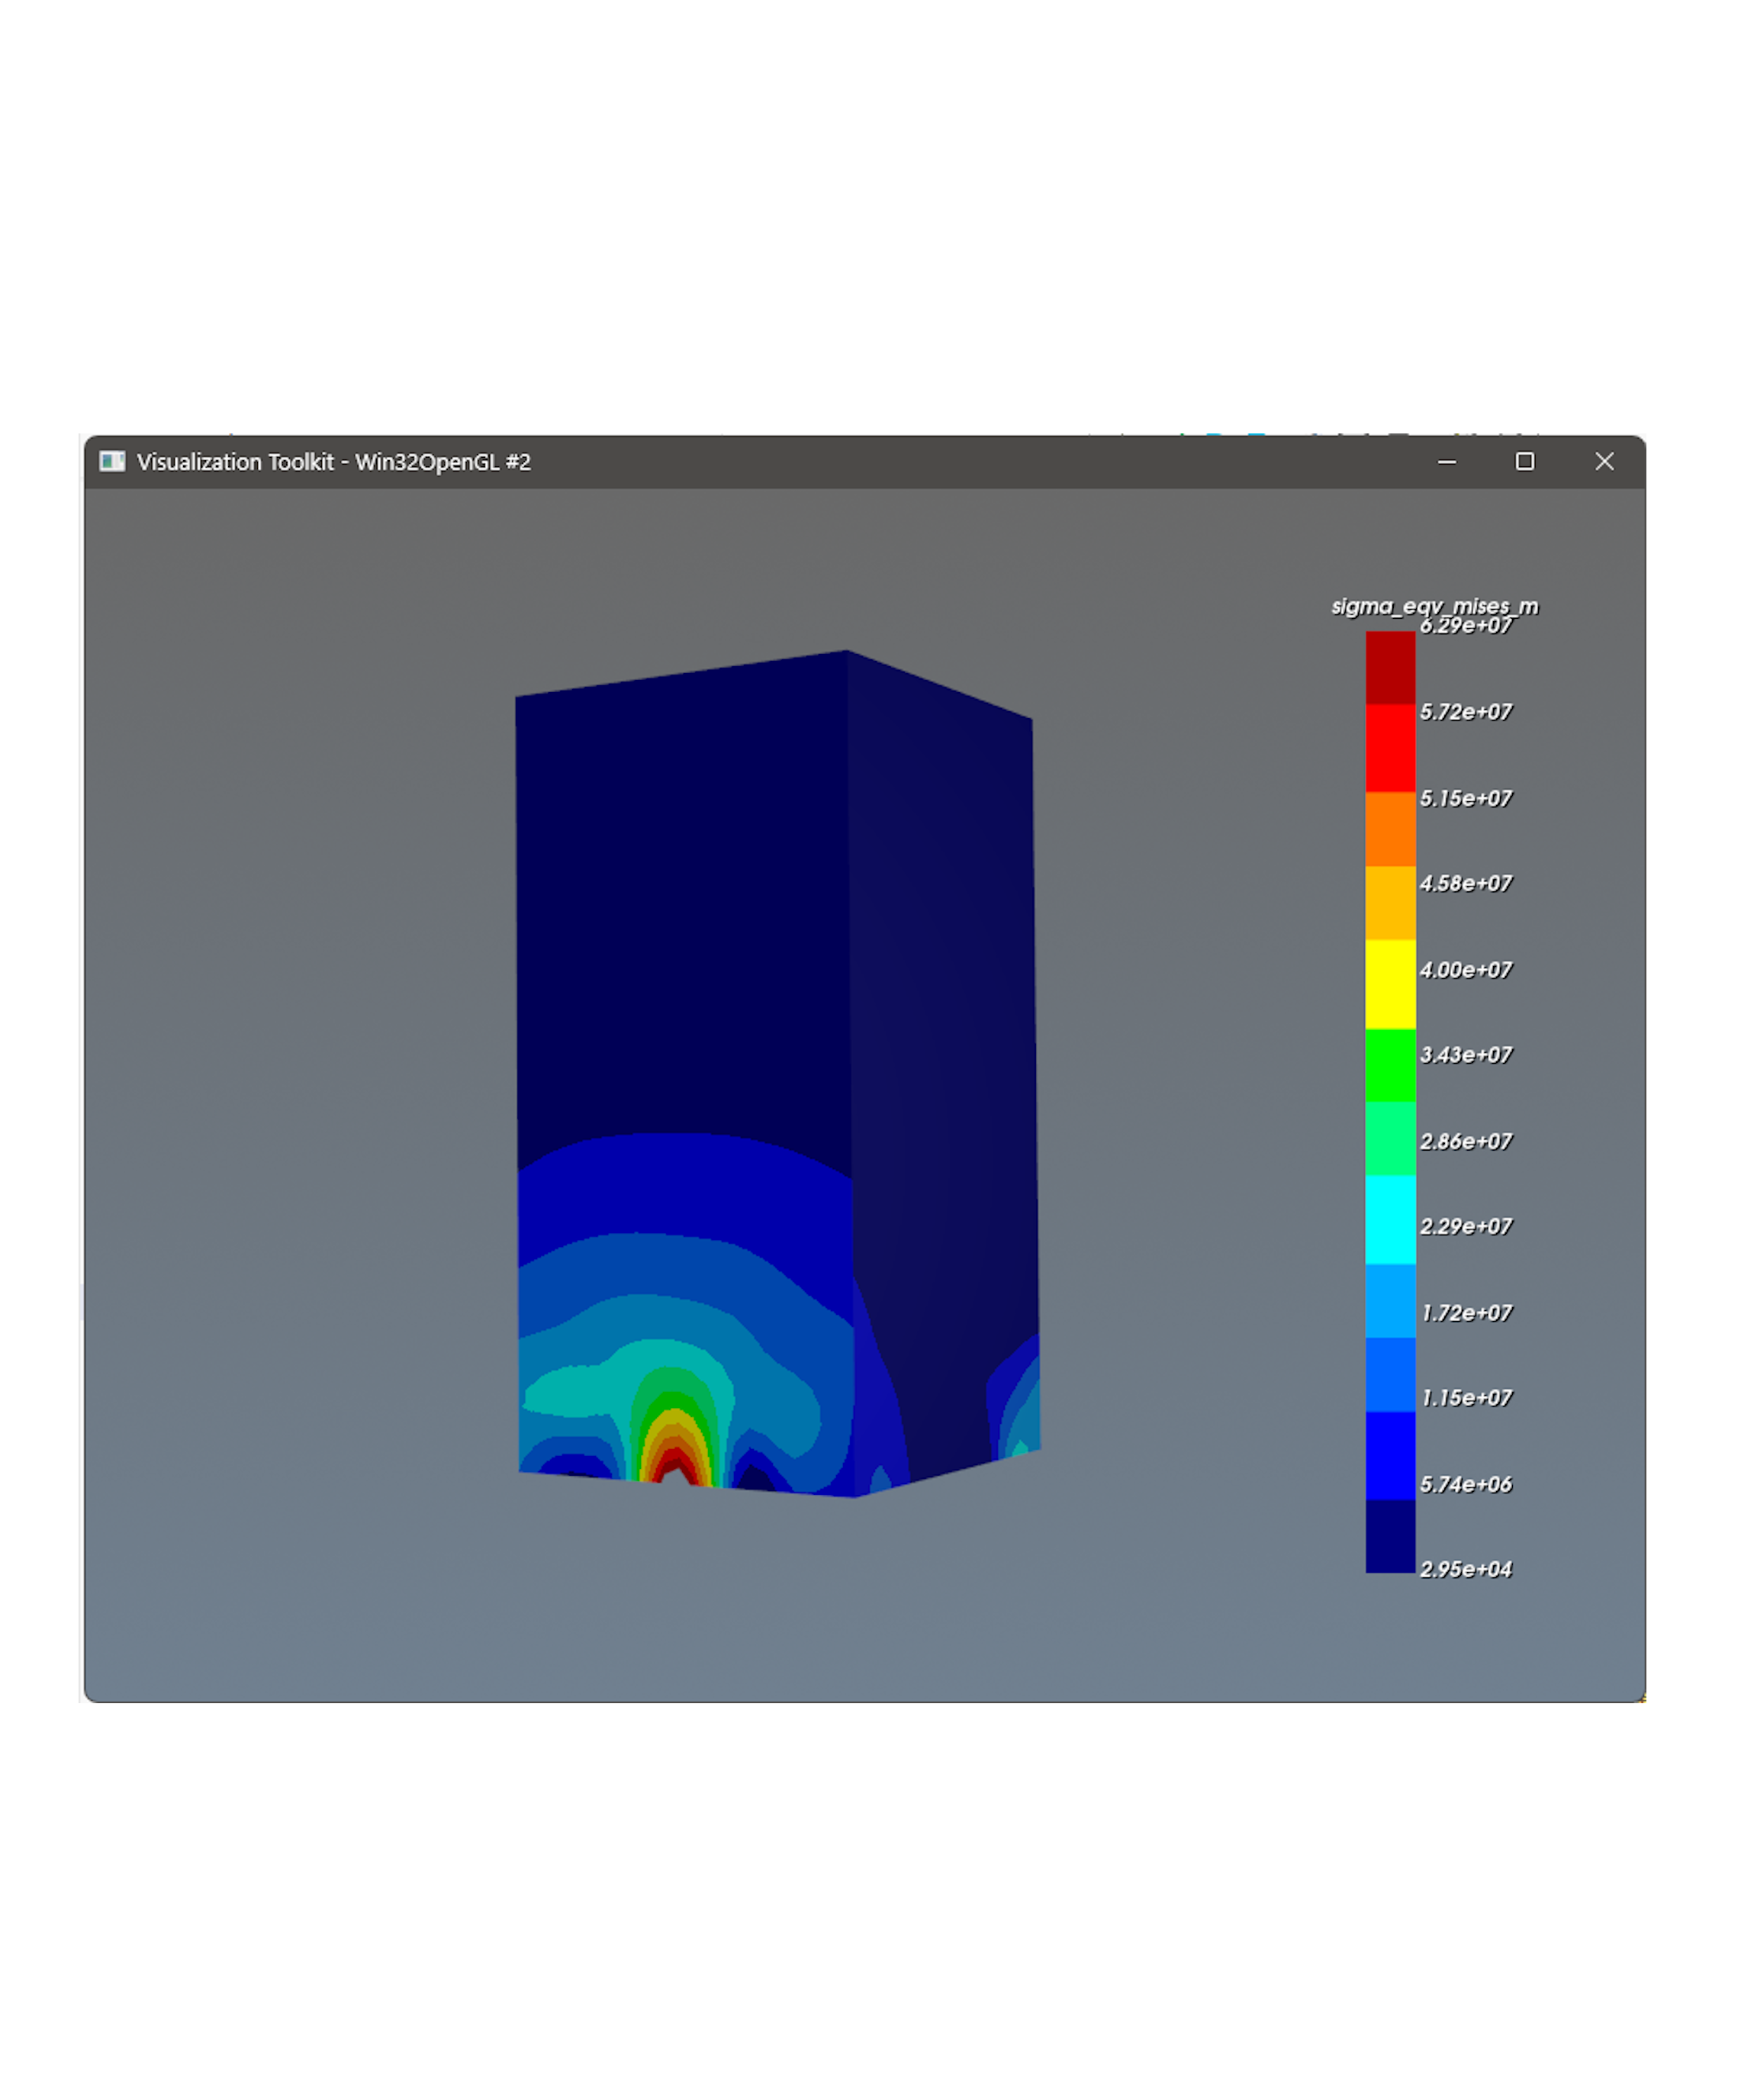
column_id="sigma_eqv_mises_m"
)
# # Access the point data array and scale the stress values from Pa to MPa (divide by 1,000,000)
# point_data = polydata.GetPointData()
# stress_array = point_data.GetArray("sigma_eqv_mises_m") # Get the specific stress array
# if stress_array:
# # Scale all stress values from Pa to MPa
# for i in range(stress_array.GetNumberOfTuples()):
# stress_value = stress_array.GetTuple1(i) # Get the stress value in Pa
# stress_array.SetTuple1(i, stress_value / 1e6) # Convert to MPa
# Display specified VTK polydata using the original color mapping
vtk_visualizer.display_vtk_polydata(
polydata=polydata
)